![](https://pro2-bar-s3-cdn-cf4.myportfolio.com/d900516e769b5d596d2619cd3eb0caed/f2c5dc2a-1f61-4f64-87af-4d0b2287fbf9_rw_3840.png?h=ed303fa0ab9500537119c8995dbad965)
![](https://pro2-bar-s3-cdn-cf.myportfolio.com/d900516e769b5d596d2619cd3eb0caed/1f1f4999-0466-41fa-8b74-b7816447d098_rw_3840.png?h=dedd366ab325f560de3108718dbe4383)
![](https://pro2-bar-s3-cdn-cf2.myportfolio.com/d900516e769b5d596d2619cd3eb0caed/d84e761e-531a-49ca-8b6e-fe958cb99ca3_rw_1920.png?h=9129a8e2c0d50e099496107795f11ff2)
![](https://pro2-bar-s3-cdn-cf3.myportfolio.com/d900516e769b5d596d2619cd3eb0caed/e6788ae2-2a4f-4196-86f3-167fc43e0e64_rw_1920.png?h=26f1cdc9a8521b76492eb618f13bdbf2)
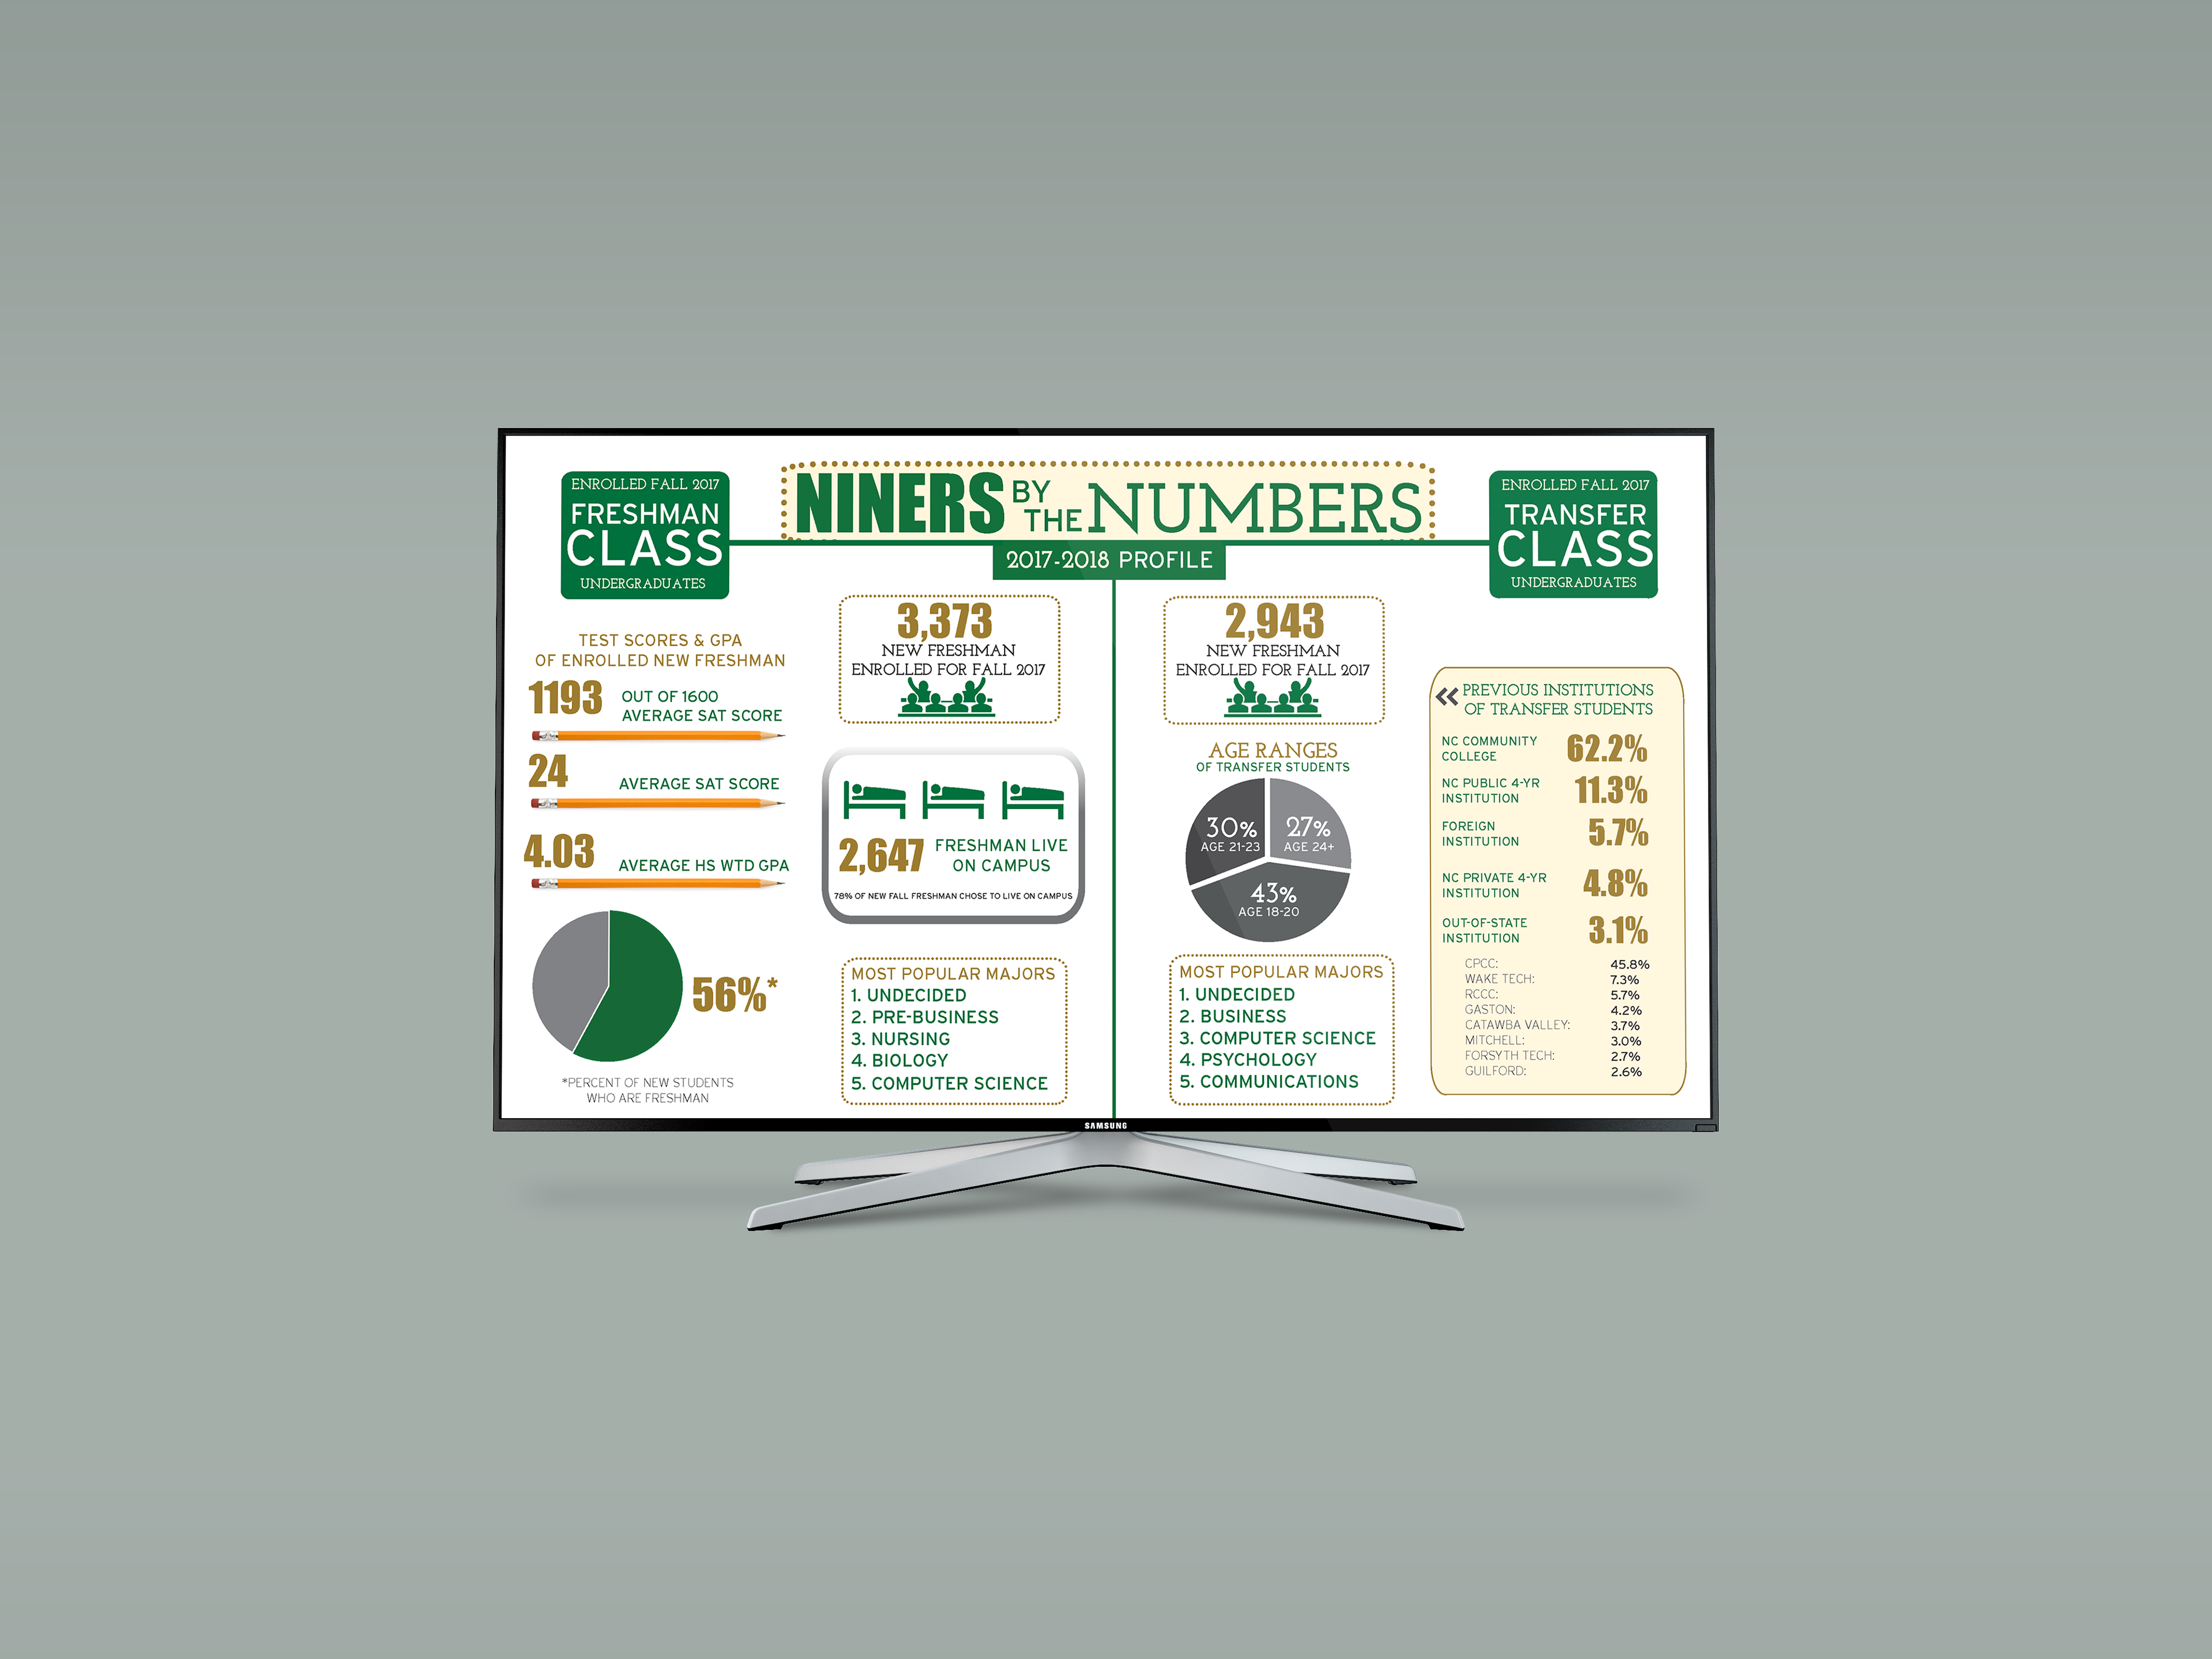
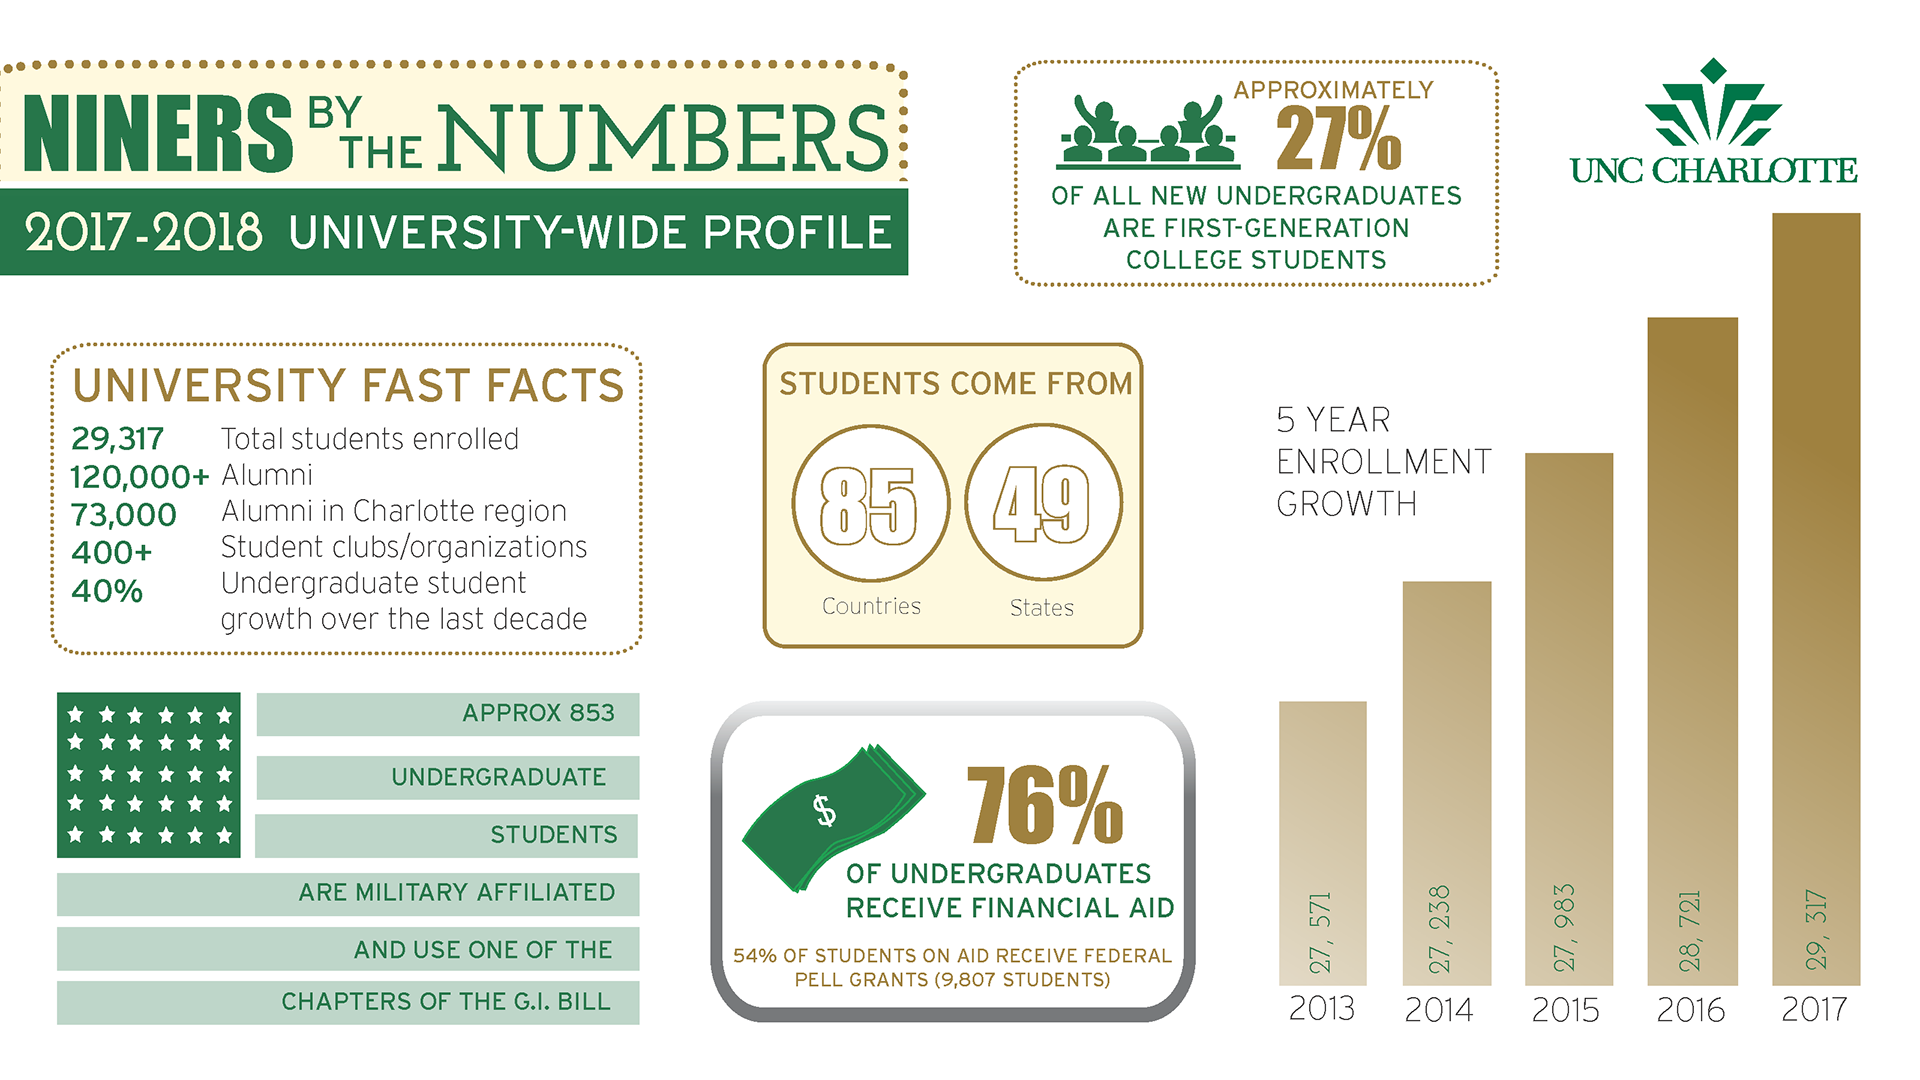
Infographic for UNC Charlotte's ITS (Information Technology Services) department to show campus stats. Using University branding standards, and a large collection of data, the information is categorized in a way that is easier to understand for students, faculty and staff. Shown on TV monitors around campus.